The $50 billion category

Screen Shot 2023-04-29 at 10.17.42 am

When sales enablement software vendor Highspot @Highspot announced a Series D-1 investment round in December 2019, CEO Robert Wahbe told GeekWire about “this $50 billion category”.

I’m not sure what the category is here.

Sales Enablement? CRMs? MarTech?

Salesforce.com, Inc. had a revenue of $21.25Bn USD in 2021 for reference.

As I’m trying to show with this blog and my market overviews – I think the Sales Enablement SaaS market will reached $11.06Bn USD in revenue a year in 2024.

1_o0Jh1fVqEKFRPPcd8pklrg

Depending on which category we are talking about I see these options for you if you find yourself in charge:

Screen Shot 2023-02-14 at 10.58.25 am

Over my career since 2007, I have been part of 3-4 large custom built Sales Enablement software projects for companies in North America, Europe, and APAC. For some reason they were all in telecommunications or enterprise information management & IT System Management solutions technology / IT services.

The most recent (2017/2018 for me) was a multi million dollar one in APAC and is still going; seen as a success internally.

Essentially the old “buy versus build”-question… Maybe more than a few hundred million USD go down that path a year, but I’m sure that is shrinking – with the success of SaaS and open source.

Obviously using open source content management software such as Drupal still comes with costs.

I still don’t see how the entire pie above would add up to $50Bn USD.

Maybe to get to the $50Bn USD a year category you have to frame it as MarTech’ given Gartner found that in 2018 “marketers spent 29 percent of their budgets (not including media spend or agency fees) on martech”.

chiefmartec mentions that “over the past six years, hundreds of martech start-ups raised a ton of capital (Venture Scanner puts the figure at $49 billion)”. There you go!

As I mentioned in my blog post from 2018 I don’t think many of the vendors I am tracking are profitable. Many never will be.

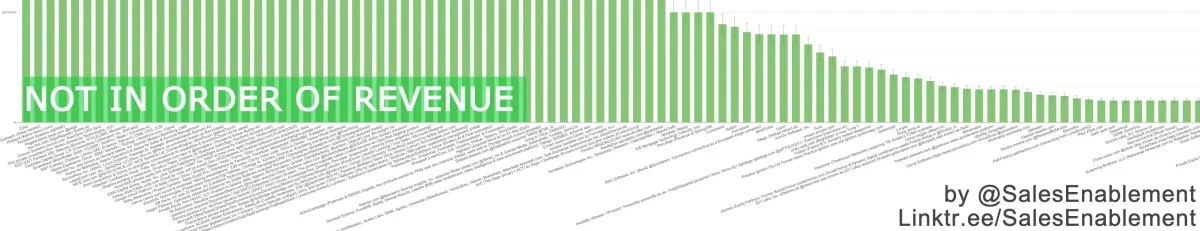
The whole point of this graphic of mine is actually in the text/labels where you can see who bought who (to acquire reoccurring revenue and show growth):

1_o0Jh1fVqEKFRPPcd8pklrg

Elay Cohen @elaycohen CEO & Co-Founder of SalesHood @saleshood is calling for the sales enablement category to get quantified.

He believes the category equals

= ((total software, consulting, training, content spend

– minus CRM spend) per person)

* (the number of customer-facing employees + partners)

He also believes that the real spend (as per the math above?) is about

$2,500USD a year * the number of “sellers” (customer-facing employees + partners) which some sources put at 15M sellers.

Hence he gets to $37.5Bn USD a year!

Screen Shot 2024-04-12 at 11.40.22 am

Workplace Collaboration Market Map and Sales Enablement vendors by revenue

Workplace Collaboration Market Map by Merci Victoria Grace

Merci identified 8 categories of workplace collaboration startups: Messaging, voice & video, calendar & meetings, documentation, project management, design, search & context, & low code / no code & internal tools:

Workplace Collaboration Market Map by Merci Victoria Grace

A number of the companies shown above are listed on this blog of mine here for their use cases in Sales Enablement: Asana, Notion, Airtable, Pitch, Canva, Guru, Chorus, etc… Slack might be on the next updated market map… and I’m a big user of Zapier myself.

Notion said 8-Sep-2021 it acquired Automate.io, an Indian startup that builds connectivity & integrations with 200+ services, as the workplace productivity startup looks to accelerate its product expansion to become more compelling for tens of millions of individuals & businesses that are increasingly moving to digital collaborative tools. The San Francisco-headquartered startup, last valued at $2Bn in private markets, said the acquisition of the Hyderabad-headquartered Automate will help Notion understand the know-how of — & leverage — the 200 integrations the Indian startup has developed to give users and enterprises alike the ability to bring their workflows into Notion.

For my own market overview for Sales Enablement I created the chart below (777 line items from this Airtable).

Just like Merci who notes in her blog post “workplace collaboration is largely dominated by Microsoft and Google’s respective productivity suites.” I have also added Google on this chart & my lists as Google Cloud Platform (G Suite / Drive / Docs / Sheets / Slides / Keep / Forms / Sites / programmablesearchengine.google.com / Bard, Google’s experimental conversational AI service powered by LaMDA).

sales_enablement_martech_market_2024

Searching through the entire b2b Sales Enablement software market

If you want to find out if a specific name is already being used by a Sales Enablement vendor or you work for a vendor and want to see if they have been mentioned on this blog, please try the search on this blog (upper right on desktop) or on my Airtable.

I never used to see the point in these types of graphics (landscapes) putting together many vendor logos visually…

Screenshot 2024-05-08 at 9.47.10 AM

See marketing-technology-landscape-supergraphic-2022

…where the nature of the media format and the effort involved only allow updates once a year (some companies included went out of business; See my constantly updated list of dead Sales Enablement companies)…

…and there is no clicking through on individual companies.

However, I like the concept of the interactive graphic over at vendorneutral.com by @Vendor_Neutral where each logo is a link:

For easy sorting and filtering/searching through the entire (835 line items) Sales Enablement software market (and exporting/downloading it) I put together this airtable:

Airtable let’s me show the relationships between the vendors:

1_o0Jh1fVqEKFRPPcd8pklrg

If you prefer blog post style lists with vendor logos please see my global vendor list. This is where they have their key offices:

USA 462
Canada 64
Australia 53
UK 57
India 45
Germany 30
Netherlands 10
Sweden 8
Switzerland 9
Denmark 6
Japan 6
NZ 5
Finland 3
France 10
Belgium 2
Poland 2
Costa Rica 2
China 1
Singapore 4
Mauritius 1
Spain 1
Israel 13
Mexico 1
Italy 1
Thailand 1
Latvia 1
Czech Republic 1
Argentina 1
Greece 1
Luxembourg 1
Austria 1

This is where visitors to this blog came from until 2022 (the year my blog turned 13 years old):

Screen Shot 2022-10-01 at 5.48.02 pm

Screen Shot 2022-12-28 at 2.55.22 pm